The next step is to import Mirasys VMS Audit Trail and VMS Alarms dashboards into the Grafana tool
-
Browse to extracted Grafana package
-
Copy Dashboards folder to the C:\Grafana
-
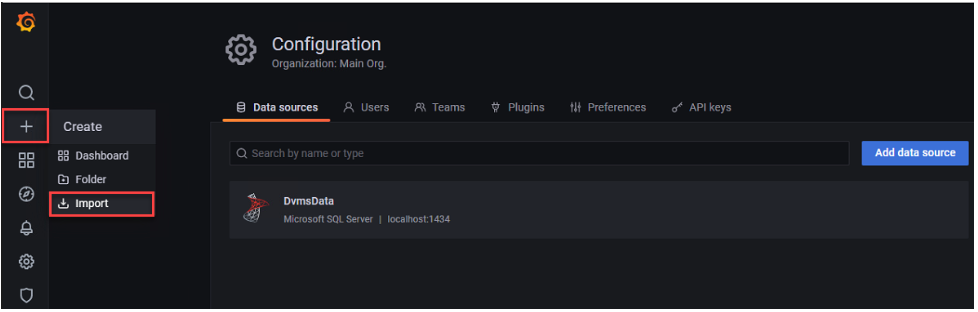
Hover over the “+” sign (left upper corner) and select+click “Import” menu item
-
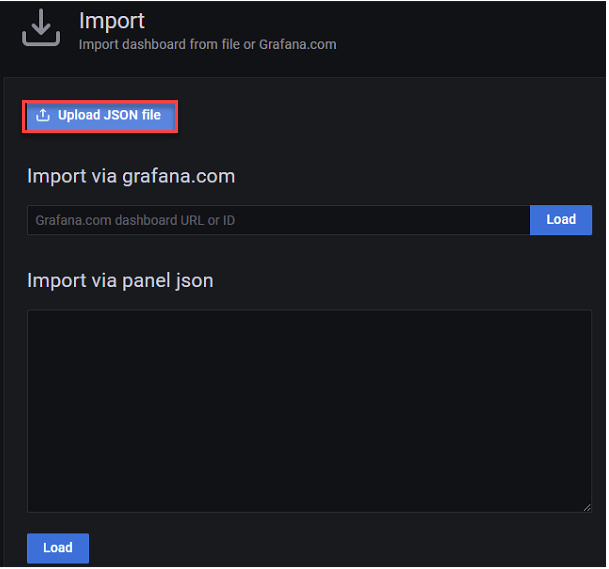
Click Upload JSON file
-
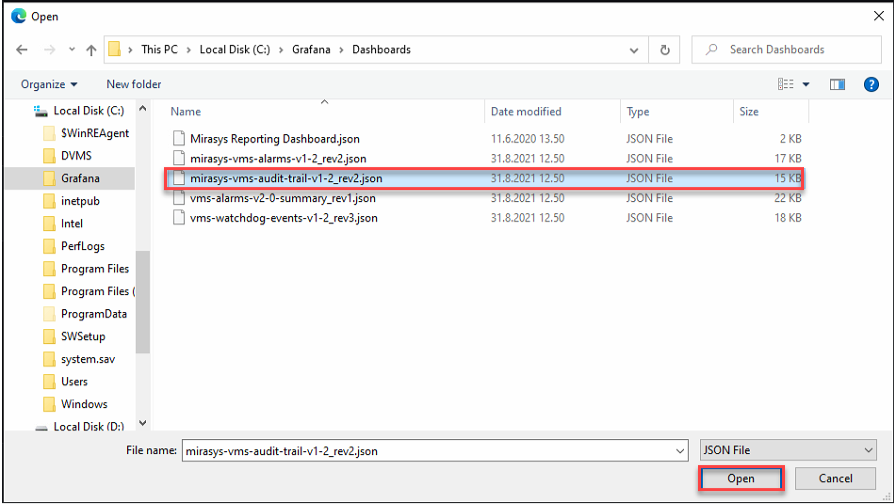
Select file “mirasys-vms auditTrail-v1-2_rev2.json
-
Click Open
-
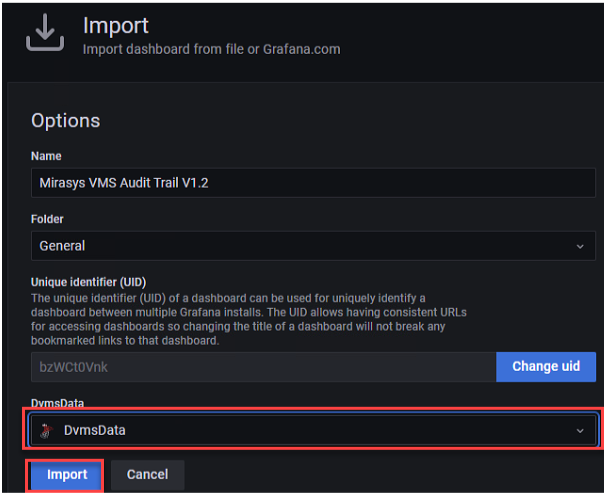
Select DvmsData from the Microsoft SQL Server data source dropdown box
-
Click Import
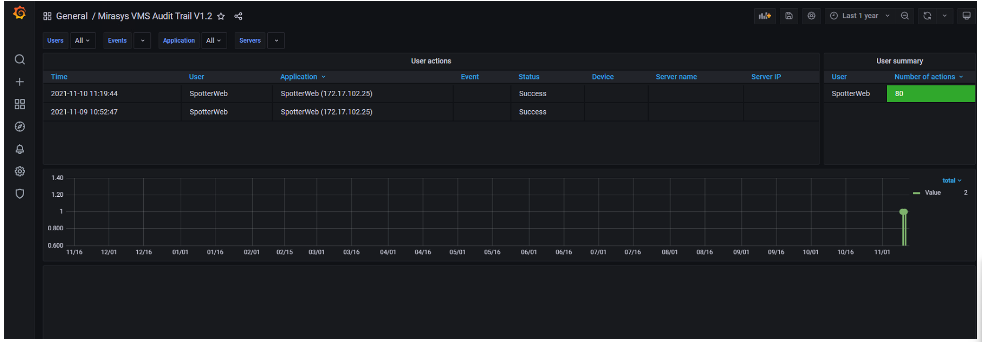
When template import is done, Grafana will automatically run the report and show results:
Before starting to use reports, repeat template import for all “DVMS*.json” files in this order:
-
VMS Audit Trail
-
VMS Alarms
-
VMS Watchdog Events