Requirements
-
Wireshark installed on target PC
-
Knowledge of IP-addresses and ports of the devices you're planning to monitor
-
Working network connection with adapter that is supported by Wireshark
Installing Wireshark
You may use default settings when installing Wireshark. There will be another program called WinPcap installed as well. This is a package that contains libpcap, which is required for capturing live network data. After installation is complete, you may start the Wireshark application.
Starting/Stopping of traffic capturing
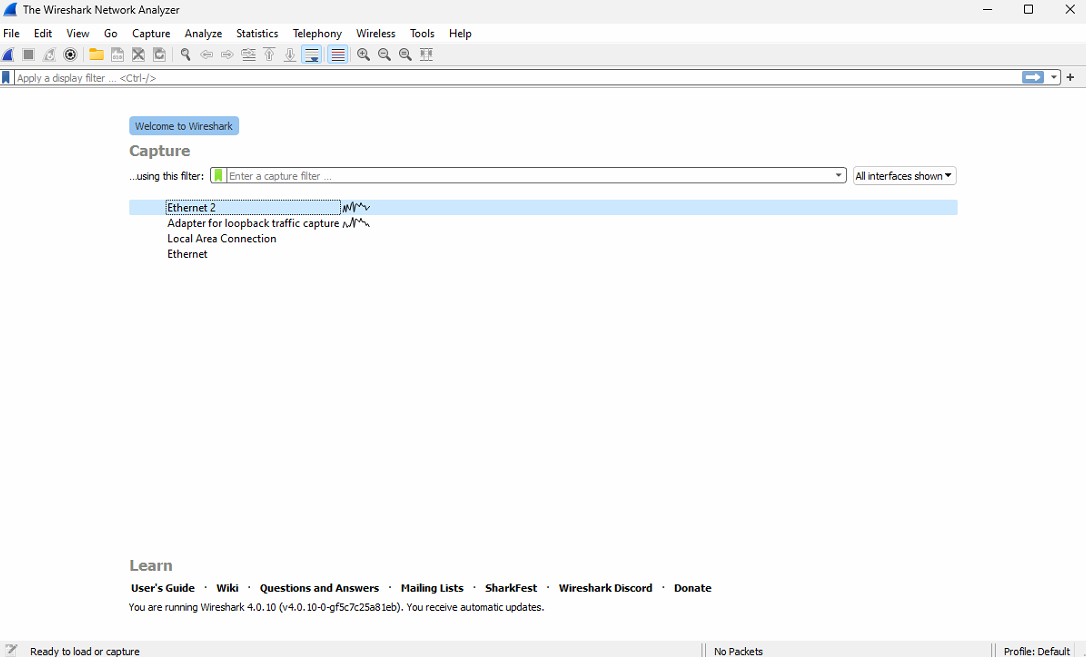
When you open Wireshark you see Welcome to Wireshark window. On this window you need select wanted network card where you want to capture network traffic. On this example we use Ethernet 2 network card.
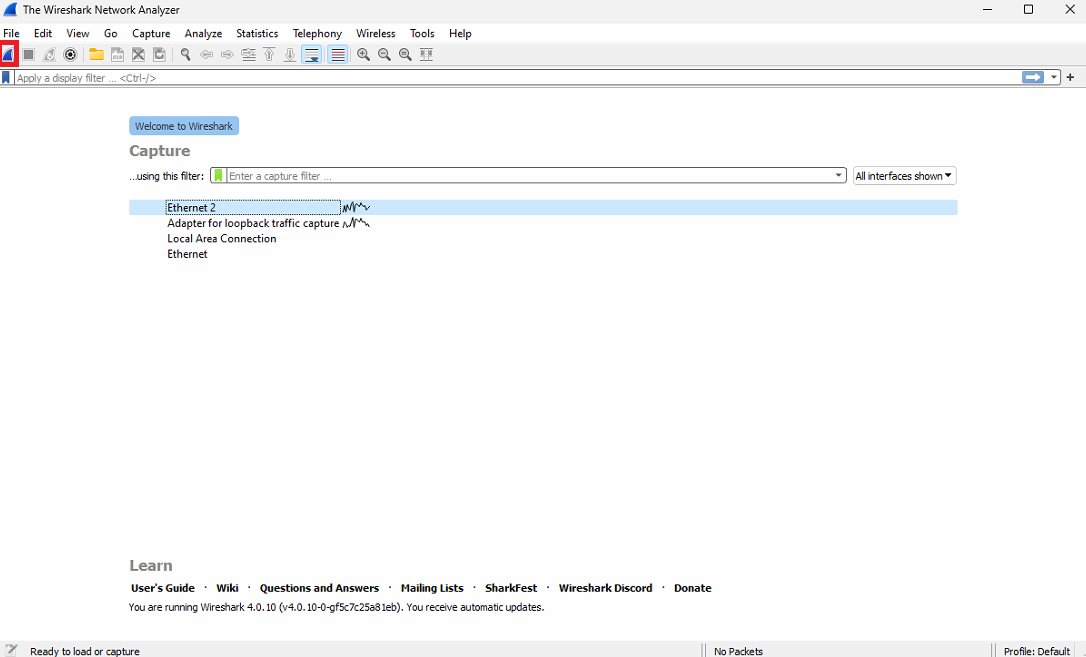
When you have selected wanted network card, you can click Start capturing packets -button to start capturing.
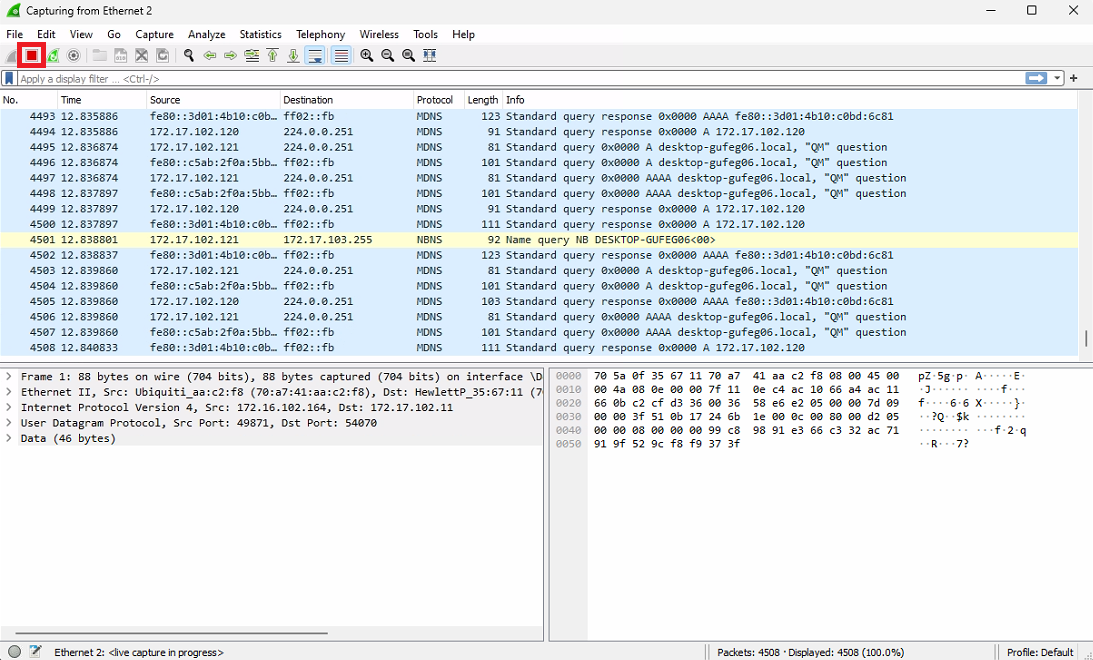
Now you can see what kind of packages is moving via this network card.

If you want to stop capturing, you need click Stop capturing packets -button.
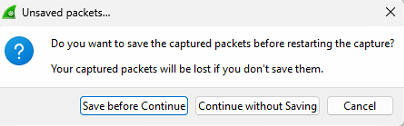
If you want to restart capturing, you need to click Restart current capture -button.

This will ask if you want to save current capture or continue without saving. If there is no need to store this capture, you can continue without saving.
Filtering traffic
By default, Wireshark will list all traffic coming in or going out from your computer through the selected network card. Most of the time it is impossible to find the relevant data from this rapidly changing list.
To find the data you need, you should use filters. Filters can be applied in the filter -field near the top of the screen.
To apply a filter, insert the filtering code inside the Filter -textbox, then click Apply or Enter.
Please find the following description how to use IP address filtering:
-
To showing/including only incoming traffic from specific IP-address the following filter should be used:
ip.src == 172.17.100.85 -
To capture only outgoing traffic the filter should looks like below:
ip.dst == 172.17.102.11 -
If all traffic between current PC and specified IP-device should be captured, the following filter should be used:
ip.addr == 172.17.100.85
The filter may contain protocol name. Useful protocols for investigation of traffic between Recorder and IP camera are:
-
http - monitor all HTTP traffic including receiving/applying camera parameters, HTTP motion streams and etc.
-
rtsp - control protocol for managing of RTP/UDP video stream receiving. It can be used to verify what is wrong with video streaming if all parameters were applied correctly
-
rtp - show RTP video/audio packets. This filter may be helpful for RTP stream analyzing
-
udp - show or hide all UDP packets (including RTP and RTSP packets). This filter can be used for exporting of captured traffic
-
xml - show only HTTP traffic which contains XML content. This filter should be used to analyze SOAP/XML-based protocols like ONVIF
Please note that all filters should be in lower case.
The protocols and IP filters may be combined using logical conditions: && for "and", || for "or" and ! for "not".
Please find couple of examples below:
-
Show HTTP and RTSP traffic for all cameras (packet is always has one protocol type, so "or" condition should be used):
http || rtsp -
Show incoming HTTP traffic from 192.168.1.55 and 192.168.1.60 cameras (brackets are used to specify condition priority):
((ip.src == 192.168.1.55) || (ip.src == 192.168.1.60)) && http -
Show all traffic between PC and 172.17.100.85 IP address except RTP video/audio data:
(ip.addr == 172.17.100.85) && !rtp
A good starting point for building more complex filters is the Wireshark wiki-article on display filters.
Finding and analyzing packets
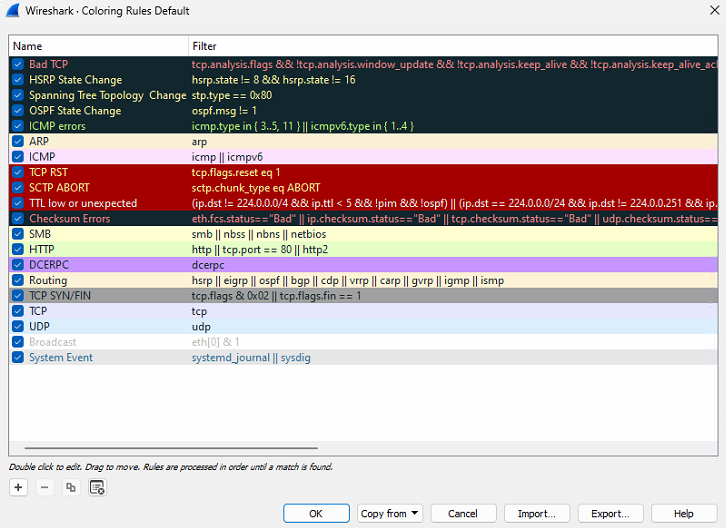
Wireshark lists packets with different colors. By default, TCP- and UDP-packets are colored with slightly different shades of blue. Samba-traffic is light yellow and bad/malformed data is displayed with black background. Current configuration can be checked from the View menu-option titled Coloring rules... . Example of the data and coloring is shown in the next figure:
To have a closer look at one of the packets, you can highlight it and it should open the details in a view near the bottom of the application window.
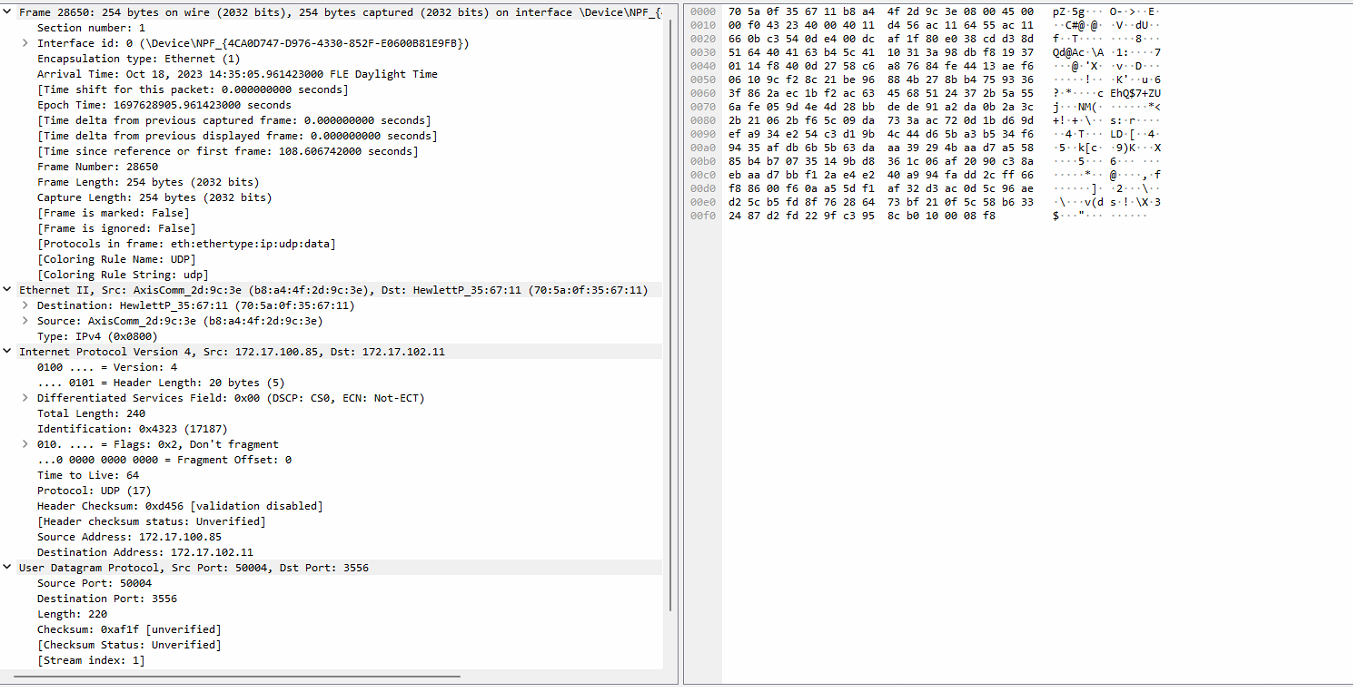
From the detailed view you can basically find out everything you need, the problem most of the time is knowing what to look for. This also depends on which devices you're monitoring and what type of traffic you're capturing.
Analyzing of RTP stream
In cases of problem with video playing on customer side it is required to check network usage.
The "Networking" tab in Windows Task Manager shows network load in percentage. To high load (over 50%) usually means non-optimal network/hardware configuration, but cases with 10-20% usage will be unclear without additional investigation.
The most of IP Capture drivers uses RTP/UDP protocols for video receiving. This protocol is faster, than TCP, but it doesn't guarantee that all packets will be delivered to the client.
The best way to check real network status is analyzing of RTP/UDP traffic between IP camera and Recorder. This operation can be done using Wireshark utility.
To perform analyzing the following actions should be made:
-
Start Wireshark utility and run capturing of data.
-
Use protocol filters to avoid showing of unnecessary packets. The following filter may be used:
(rtp || rtsp)
You can also combine it with IP filter
-
Re-start all VMS streams - it is required for proper RTP traffic recognizing by Wireshark (otherwise it may be shown as UDP). Restarting of streams may be done by applying of Camera settings in System Manager.
-
Wait couple of minutes to get enough RTP packets for analyze
-
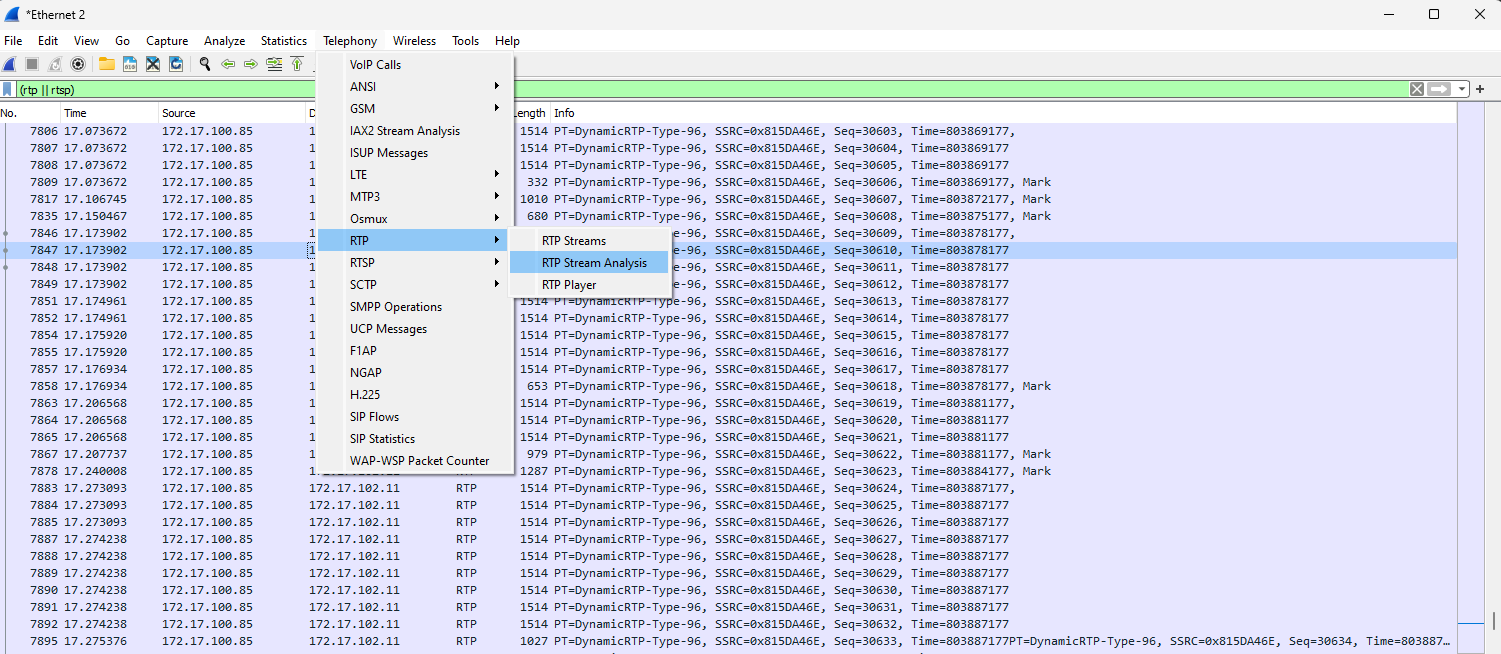
To analyze RTP stream select any RTP packet from this stream
-
Go to "Telephony" menu and select "RTP" >> "Stream Analysis..." option
-
The Wireshark will show statistics for selected RTP stream. Please pay attention to "Lost RTP packets" and "Sequence errors" options. Non-zero values means packet loses.
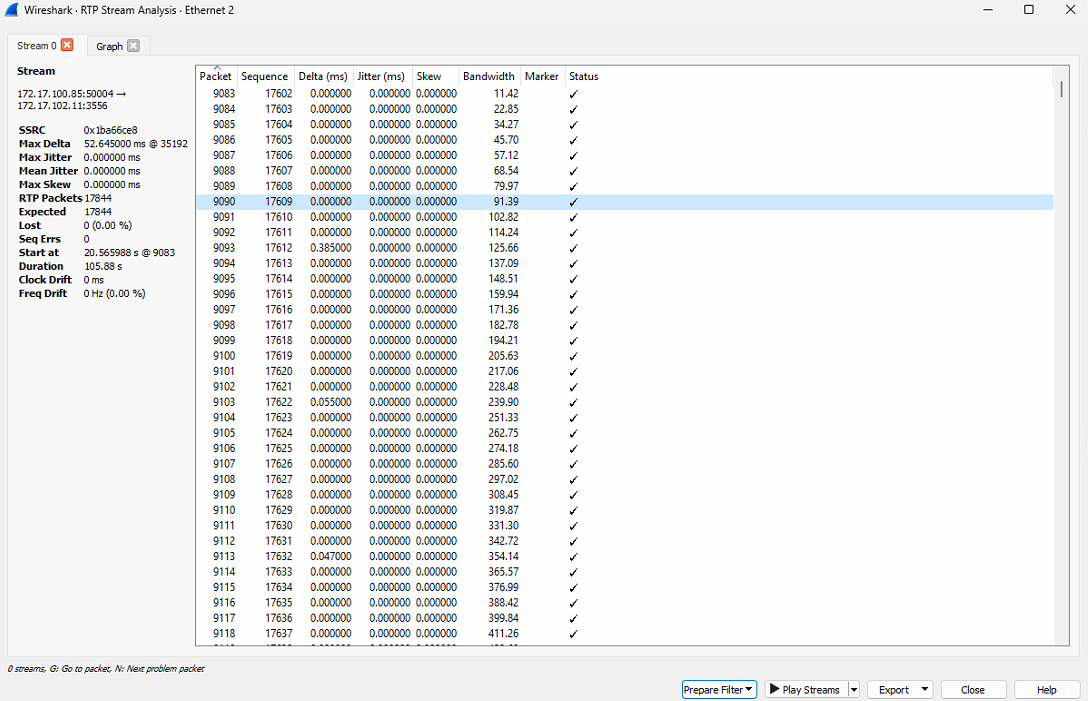
Result of the analysis may be threated in one of following ways:
-
No sequence errors or packet loses - the stream was received correctly by the driver. Probably problem in the driver or VMS.
-
Sequence errors, but no packet loses - there is active network hardware between camera and VMS which can cause such problem. Try to use another network hardware to avoid this issue
-
Packet loses and sequence errors - network bandwidth is not enough. Try to decrease camera settings or re-design network topology
Changing of UDP packet decoding
Sometimes RTP packets cannot be decoded automatically by Wireshark and they shown as UDP packets.
To decode them correctly please perform the following steps:
-
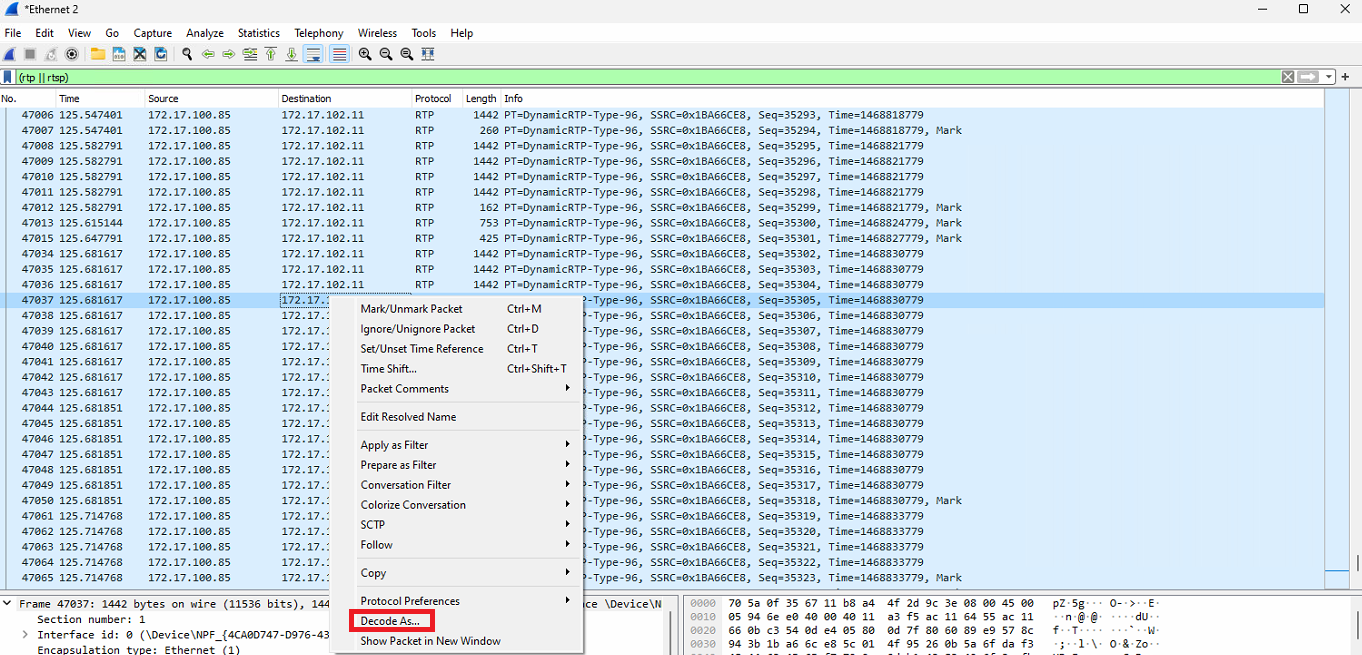
Please select UDP packet you want to decode as RTP
-
Check packet's destination port. The driver uses even ports in range 3556..4556 to receive video/audio streams (3556, 3558, 3560, etc.)
Odd port are used to control protocol (RTCP) and not interest for us -
Open context menu and select "Decode as..." option.
-
In opened dialog select options:
-
"Destination (-> 35xx)" option in combo-box
-
"RTP" protocol in list-box (can be found by typing of "RTP" on keyboard)
-
-
Close dialog by pressing OK button
Export of captured traffic
Sometimes there is no possibility to have access to the IP camera which doesn't work correctly on customer's side.
In this case Wireshark log is the easiest way to troubleshot the problem.
However in most of cases the customer sends the full traffic logs instead of small portion of required data. As result uploading and downloading the file takes more time than analyzing...
The amount of traffic may be reduced by using of Wireshark filters, but it should also be saved correctly.
To save only required amount of data the following steps should be done:
-
Stop capturing of traffic
-
Apply required filter. This step may be skipped if the filter was applied before capture started/during the capturing
-
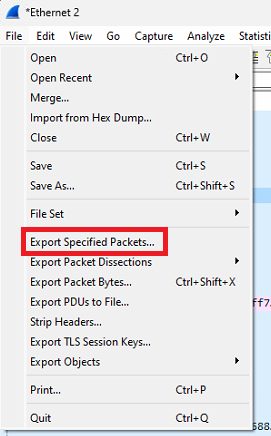
Open "File" menu and select "Export specified packets..." option
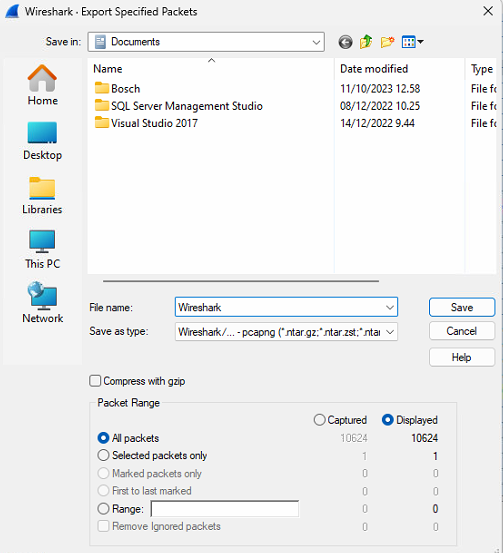
Please note, that "Save" / "Save As..." options ignores the filter and will save all captured packets. Please avoid of using them.
-
In opened Save dialog please select "All packets" and "Displayed" radio buttons as shown on figure 12
-
Select location and specify target file name for saving the log. You can also use "Compress with GZIP" check-box to move Wireshark log to archive
-
Press Save button
More information
Also please remember the following simple rules how to capture only required traffic:
-
Always use filtering by IP address (ip.addr) to avoid of capturing of additional traffic except traffic between IP camera and VMS Recorder
-
If camera cannot be added to VMS, please run traffic capture before next attempt of camera adding
-
In case of a problem with parameter applying please run Wireshark capturing before you changing camera settings in VMS
-
Do not include RTP traffic to capture log if it was not requested by Mirasys Support to reduce log size. The !rtp or !udp filters should be used in this case.
Please find example below:(ip.addr == 172.17.100.85) && !udp -
The log file should contain only traffic between IP camera and VMS Recorder.
-
So, it is necessary to close all 3-rd party applications (camera's Web-pages in browser, network players, etc.) which may uses the IP camera before capturing will be started
-
-
Compress the Wireshark log file using Windows ZIP archiver if uncompressed file size is greater than 1 Mbyte. Or you can use inbuilt GZIP archiver instead.
More information related Wireshark usage can be found Wireshark Wiki page.